UK whole home energy monitoring with Bright/Hildebrand glow/Glowmarkt
With the current energy prices in the UK increasing on an almost exponential level, I, like probably quite a few of you decided the more I know the better.
To get whole home monitoring you can use guides for CT clamps in your mains fuse box. A small device will then monitor the energy on one of the main circuits in your home. Doing this is quite involved and requires purchasing extra equipment and working with/near mains electricity. An alternative available to some of us in the UK is to request a copy of the data that is sent to the electricity suppliers via the in home display/smart meters deployed in our homes.
To do this you can sign up with Hildebrand Glow/Bright/Glowmarkt (their company naming is confusing, I’ll be calling them Bright as it’s shorter and easier). Essentially you agree to send Bright your data via your Smart Meter, and then you can also request a copy of this data for yourself once they have a copy. Bright can request this data as they’re registered SECA (Smart Energy Code Administrator) in the UK. We as individuals are not registered so we have to jump through hoops. It’s annoying roundabout to get your own data in your own systems but Bright currently offer the easiest way to do this.
Signing up with Bright
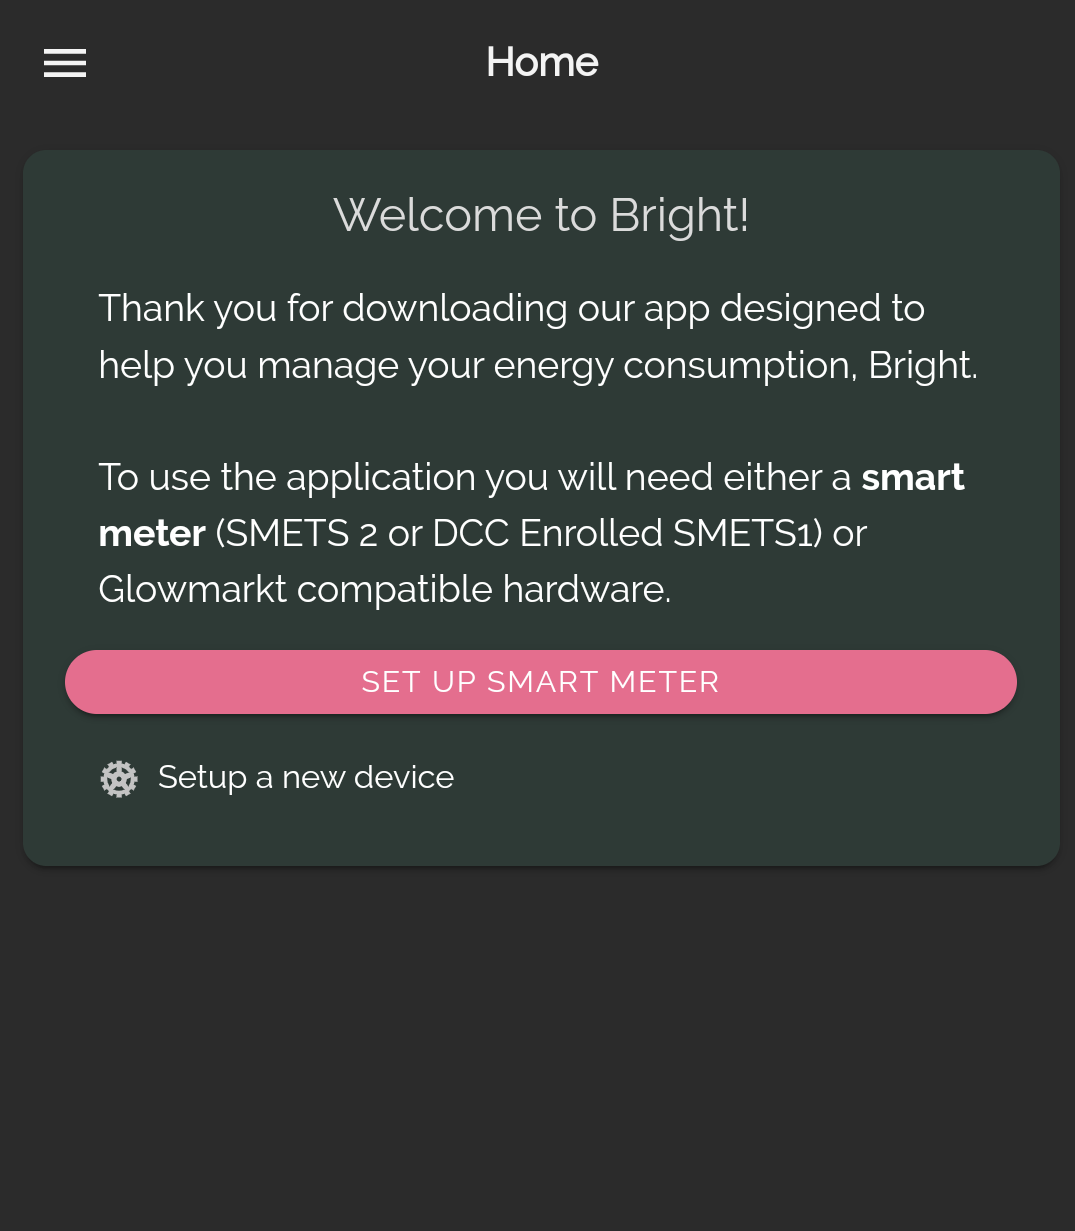
Download the Bright App on from google play or apple store.
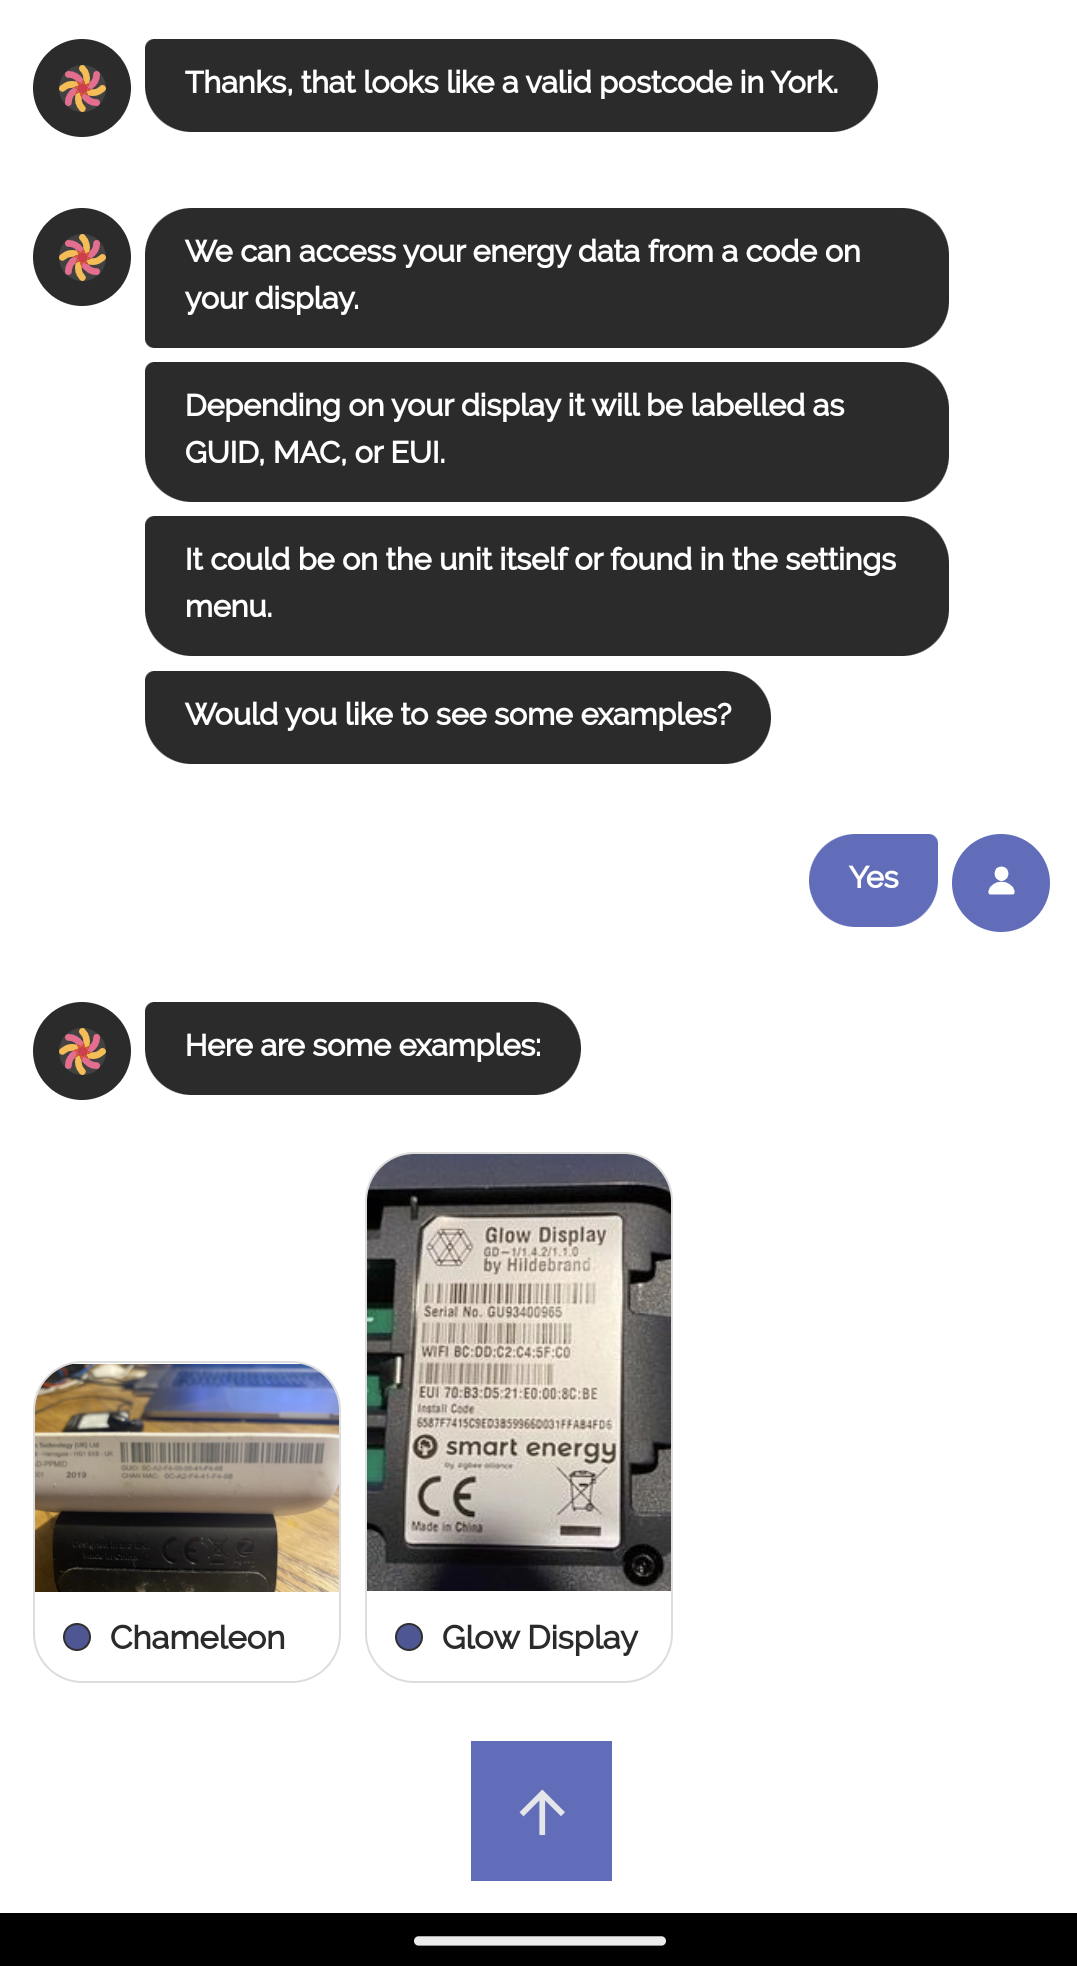
You will need to set up your smart meter. This can be done using their chat like setup seen below, follow the instructions provided you’ll need to enter your postcode and the device id. Mine was on the back of my in home display hidden behind an attached stand.
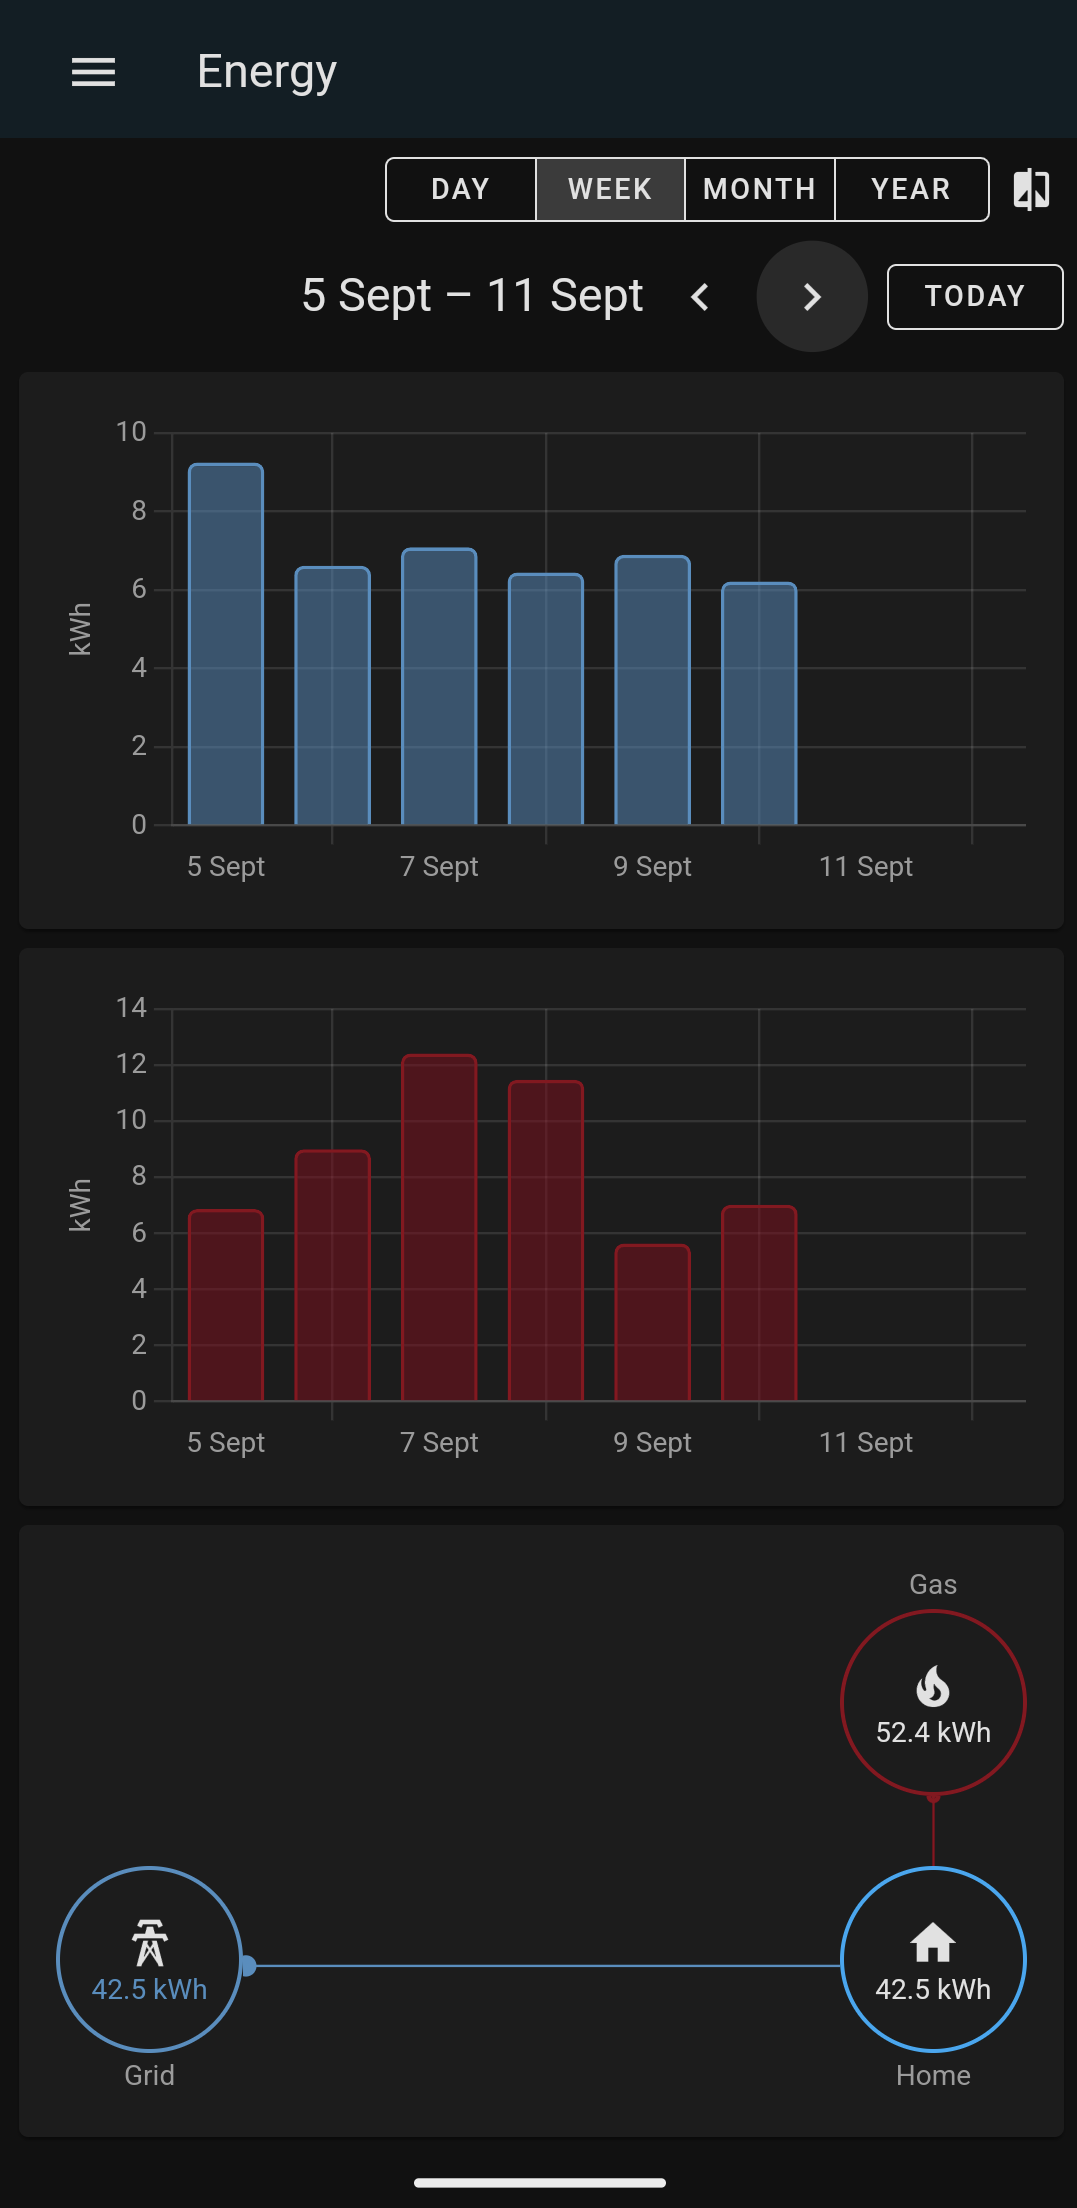
Once the setup in the application is complete, you should be able to see you data in the app, some people reported the data going back to their smart meter install but mine only shows from when I associated with Bright.
Home Screen and setup
Chat set up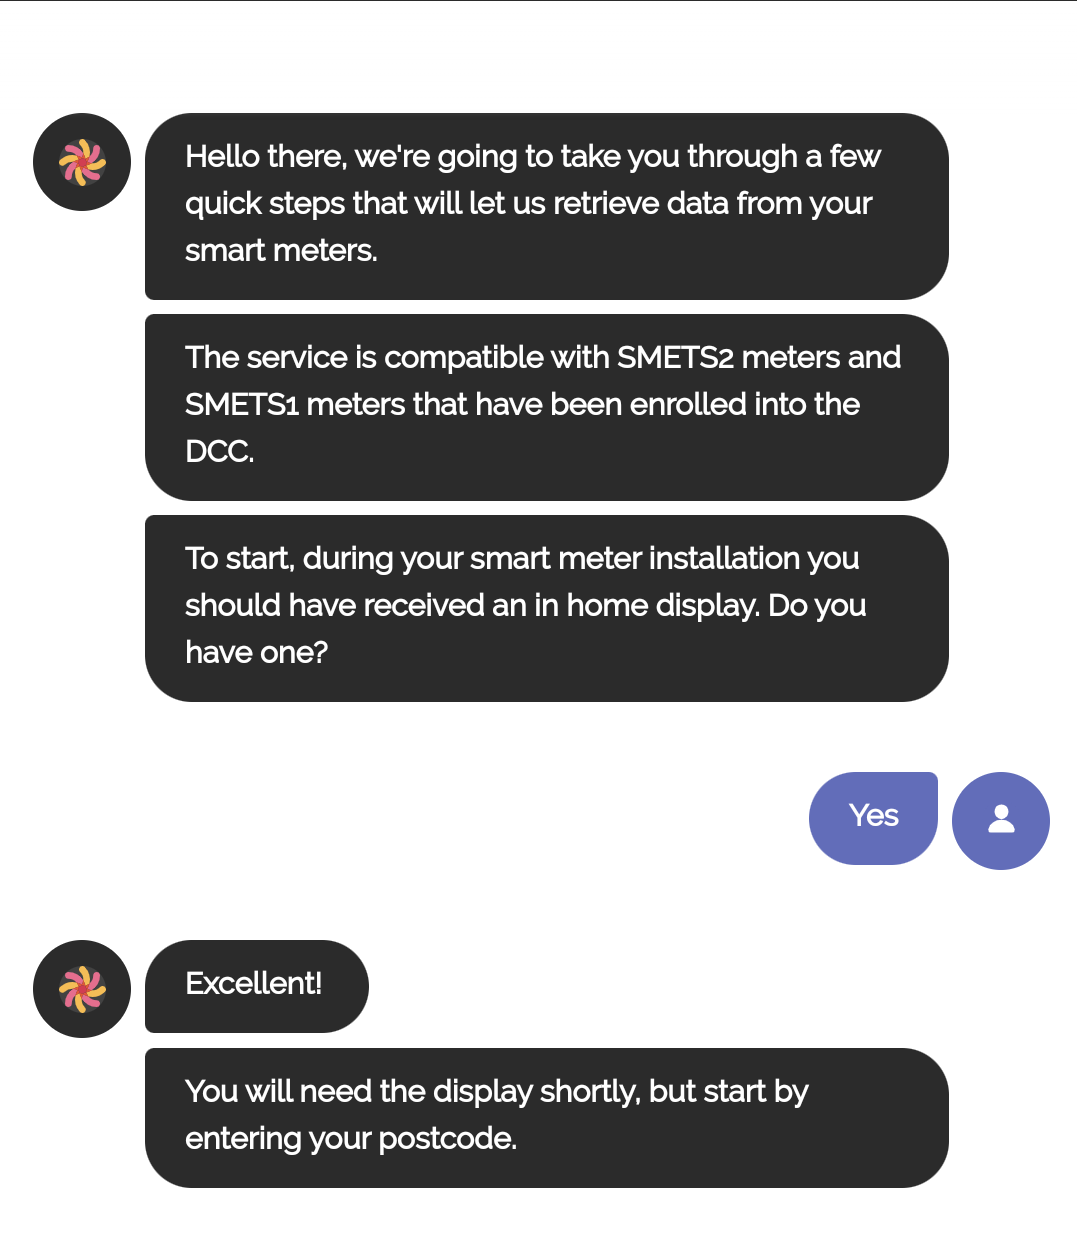
Example Data after setup
Data over a day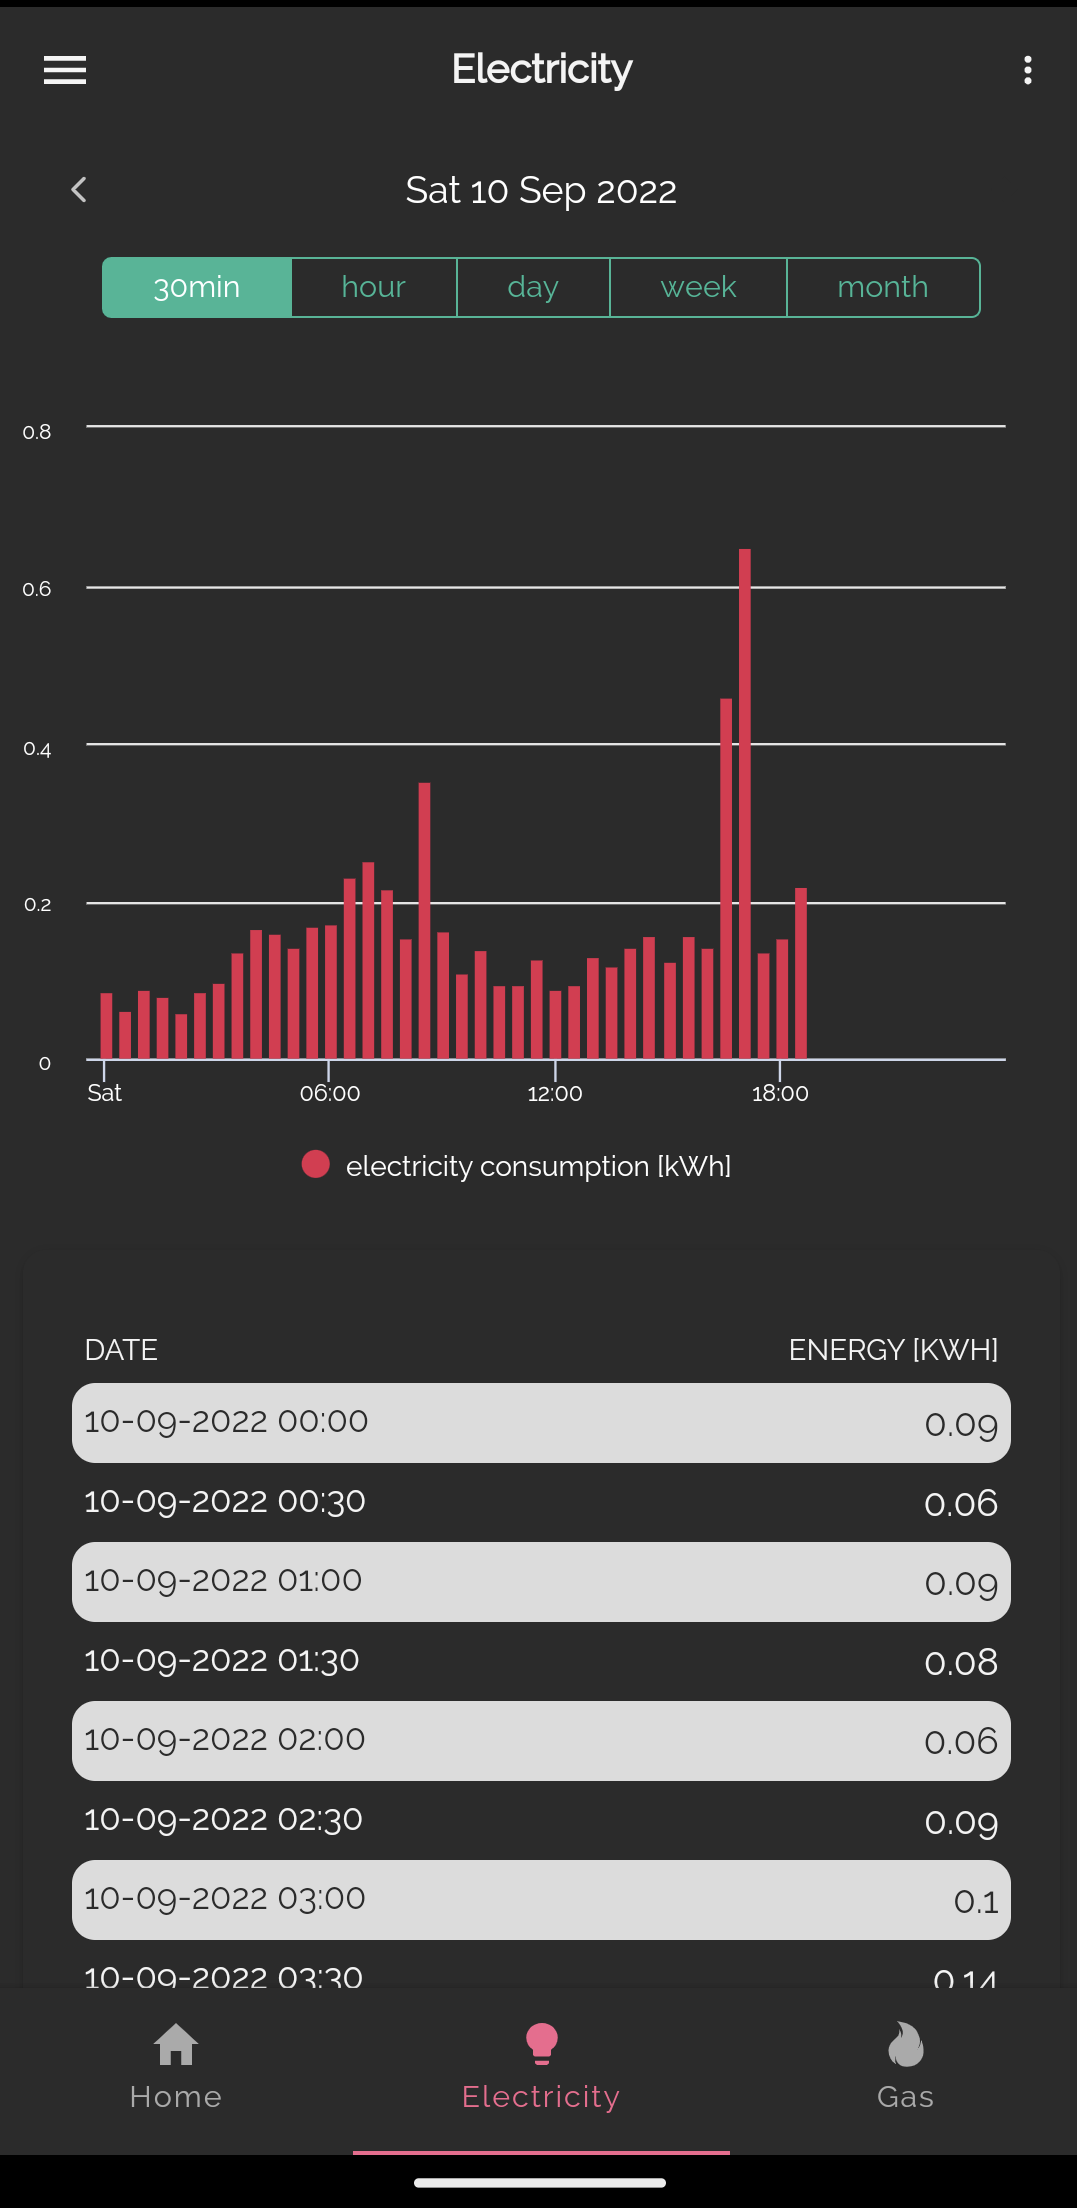
Data over months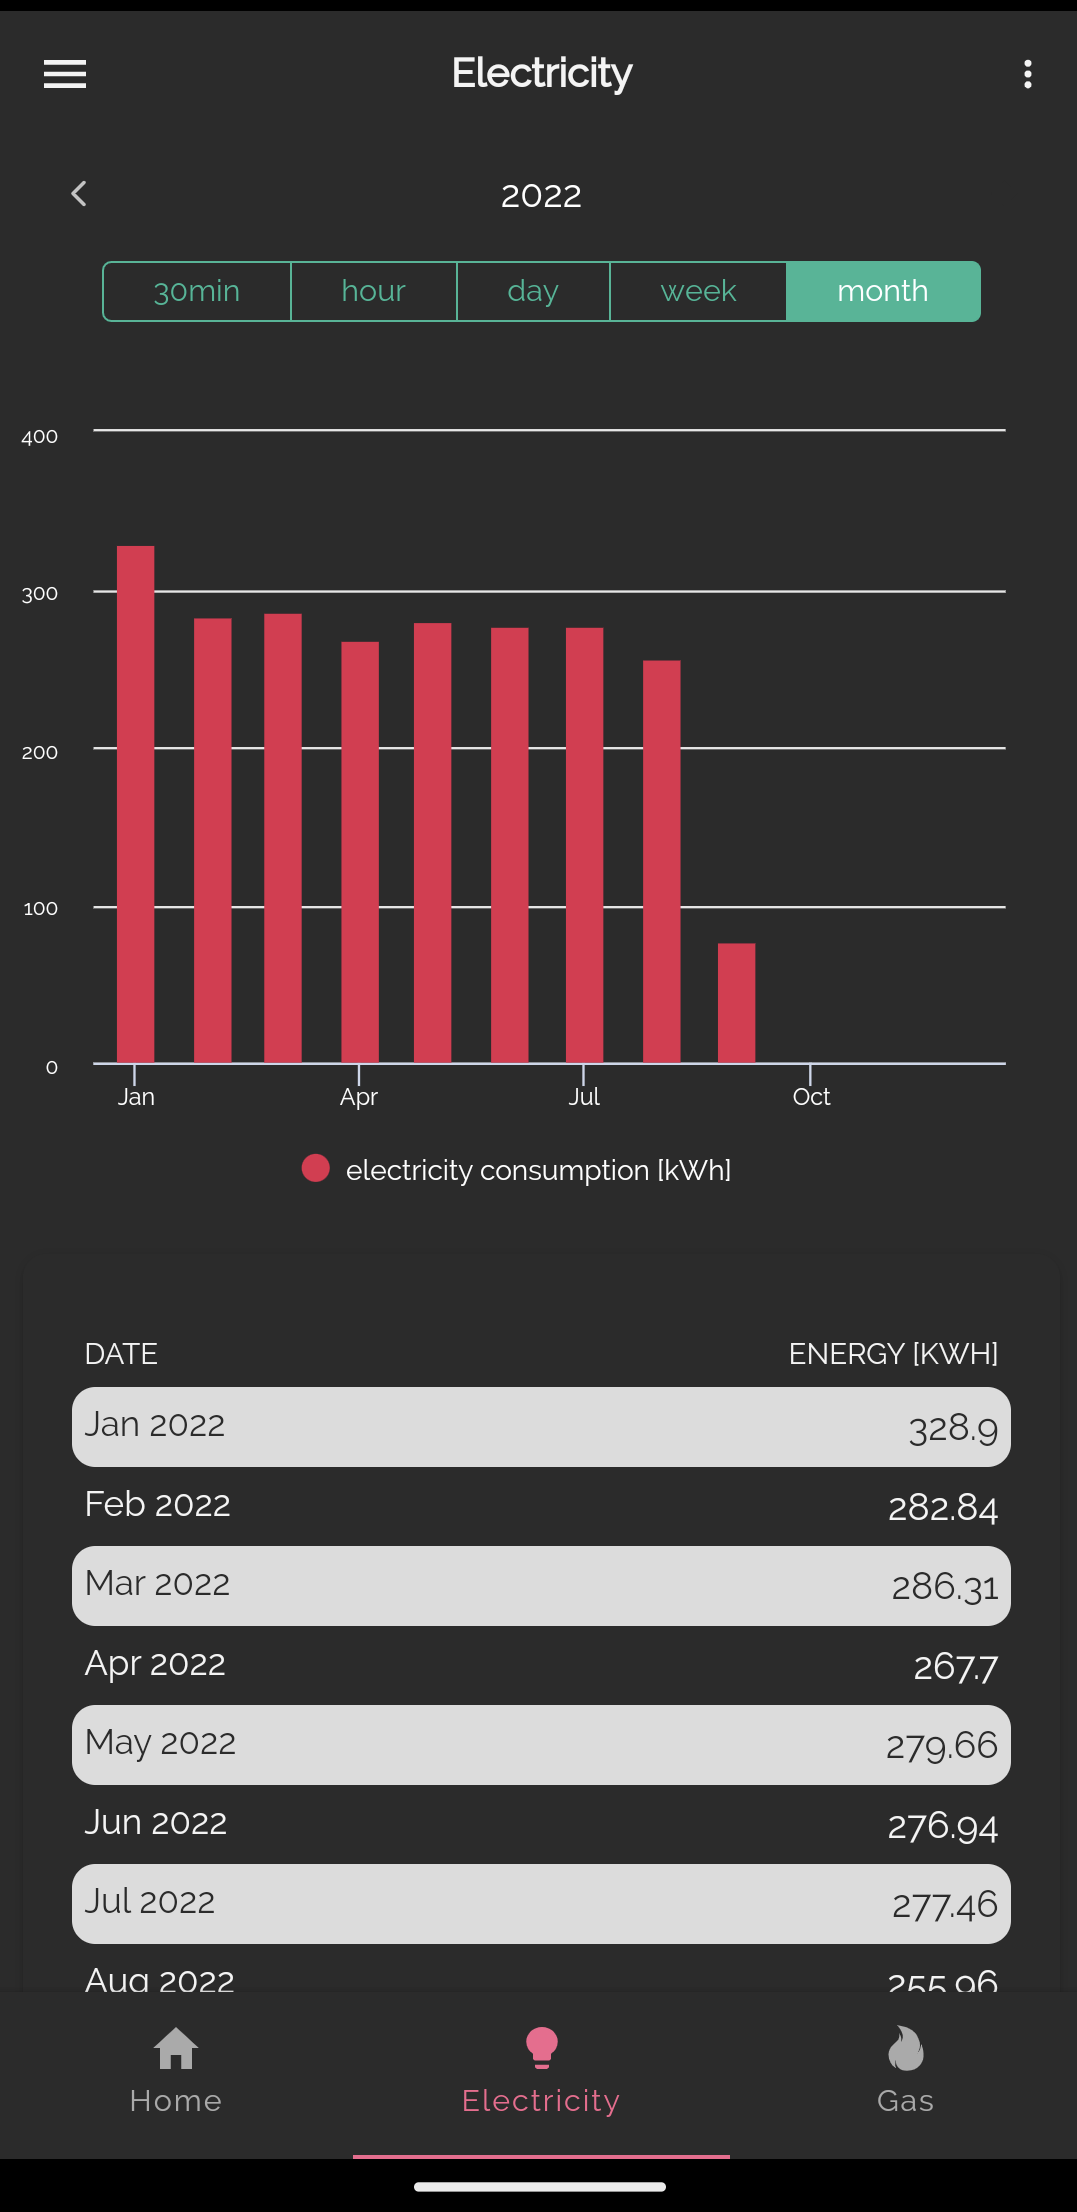
Getting the data into Home Assistant
Now that Bright have a copy of the data, you can start piping that data to Home Assistant via a custom integration. To do this we’ll need a custom integration from HACS, if you’ve never used or heard of HACS there are guide on youtube on how to install. To get the repo which integrates with Bright follow the below instructions.
- Go to the HACs integration screen
- Click on the top right then “Custom Repositories”
- Add the URL
https://github.com/HandyHat/ha-hildebrandglowand the type isintegration - Restart homeassistant
Now it’s installed, go to the “normal” integrations page to add the new integration there. Enter your username and password to get the data start flowing into homeassistant.
The data exposed by this integration is fairly comprehensive with the below data exposed
Electricity
- Energy consumption today
- Energy consumption year
- Tariff standing charge
- Tariff energy rate
- Cost Today
Gas
- Energy consumption today
- Energy consumption year
- Tariff standing charge
- Tariff energy rate
- Cost Today
Integrating these values into the HA energy dashboard
Now we have the data being piped into HA we can use these points for the energy dashboard. To do this we’ll be pulling 2 data points from each energy source (electric and gas). There are different ways to do this but the below is how I set mine up.
Navigate to the energy dashboard and initiate the wizard, first we’ll configure the electricity usage by telling HA to use the energy consumption today. Next we’ll do the same with the gas supply to pull that information if your house uses gas as the main heat source. I am still testing the cost data coming from the integration as the results seem rather high. You can also use the costs from a template sensor if you want to set it up that way.
Once these two steps are complete you should be greeted with a pretty in depth energy graph showing usage and between what hours, enjoy! A caveat on the data that I have seen is that the number in bright vs the number in HA are slightly different. For me this isn’t an issue as I’m interested in trends over time and looking at what proportion certain devices are using compared to my whole home.
Example Data in homeassistant after setup
Data over a day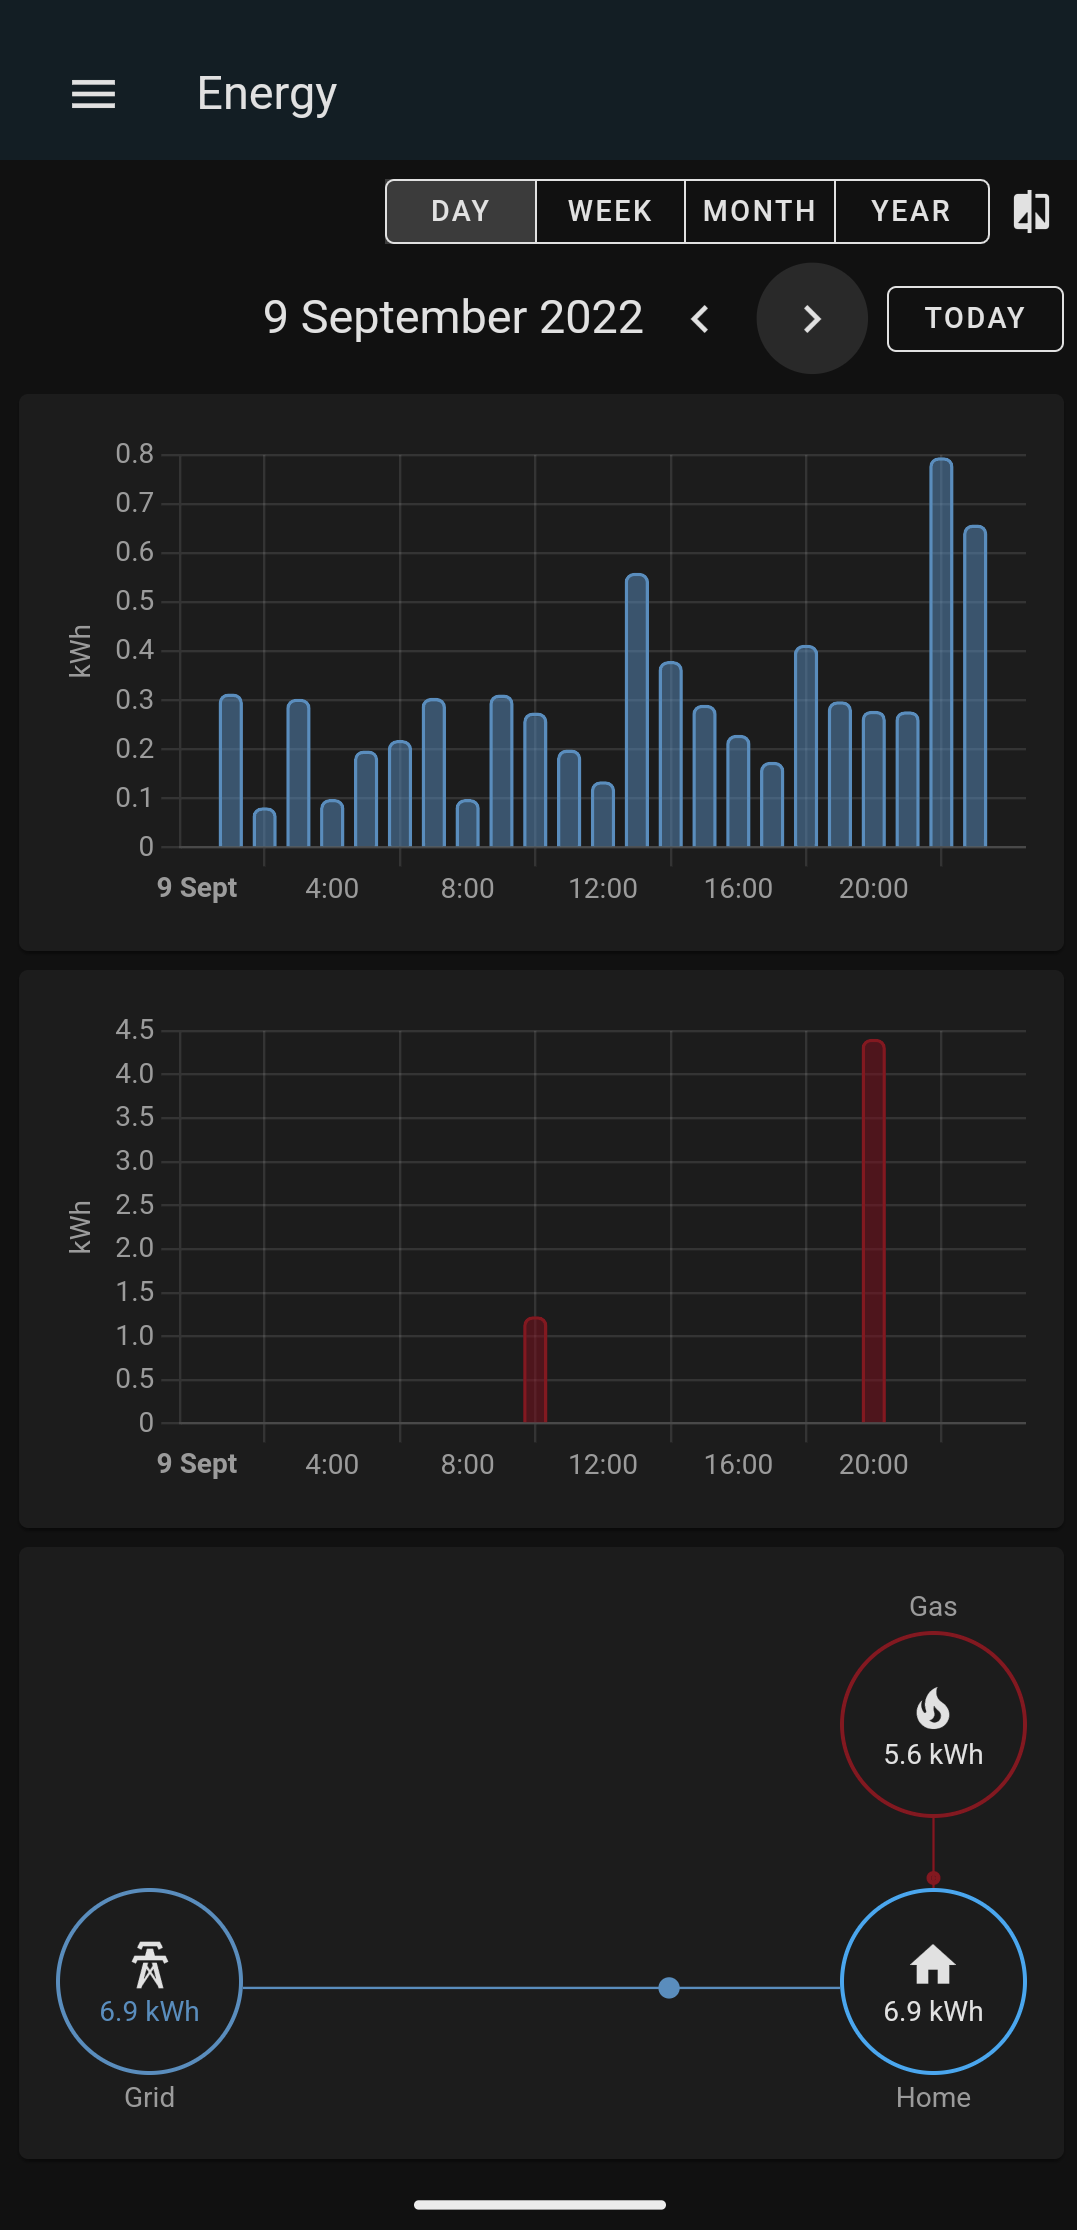
Data over months